If you want to understand what is happening in the Southern California housing market, do not look only at home prices.
Look at how many homes are actually selling.
The slowdown is showing up in turnover
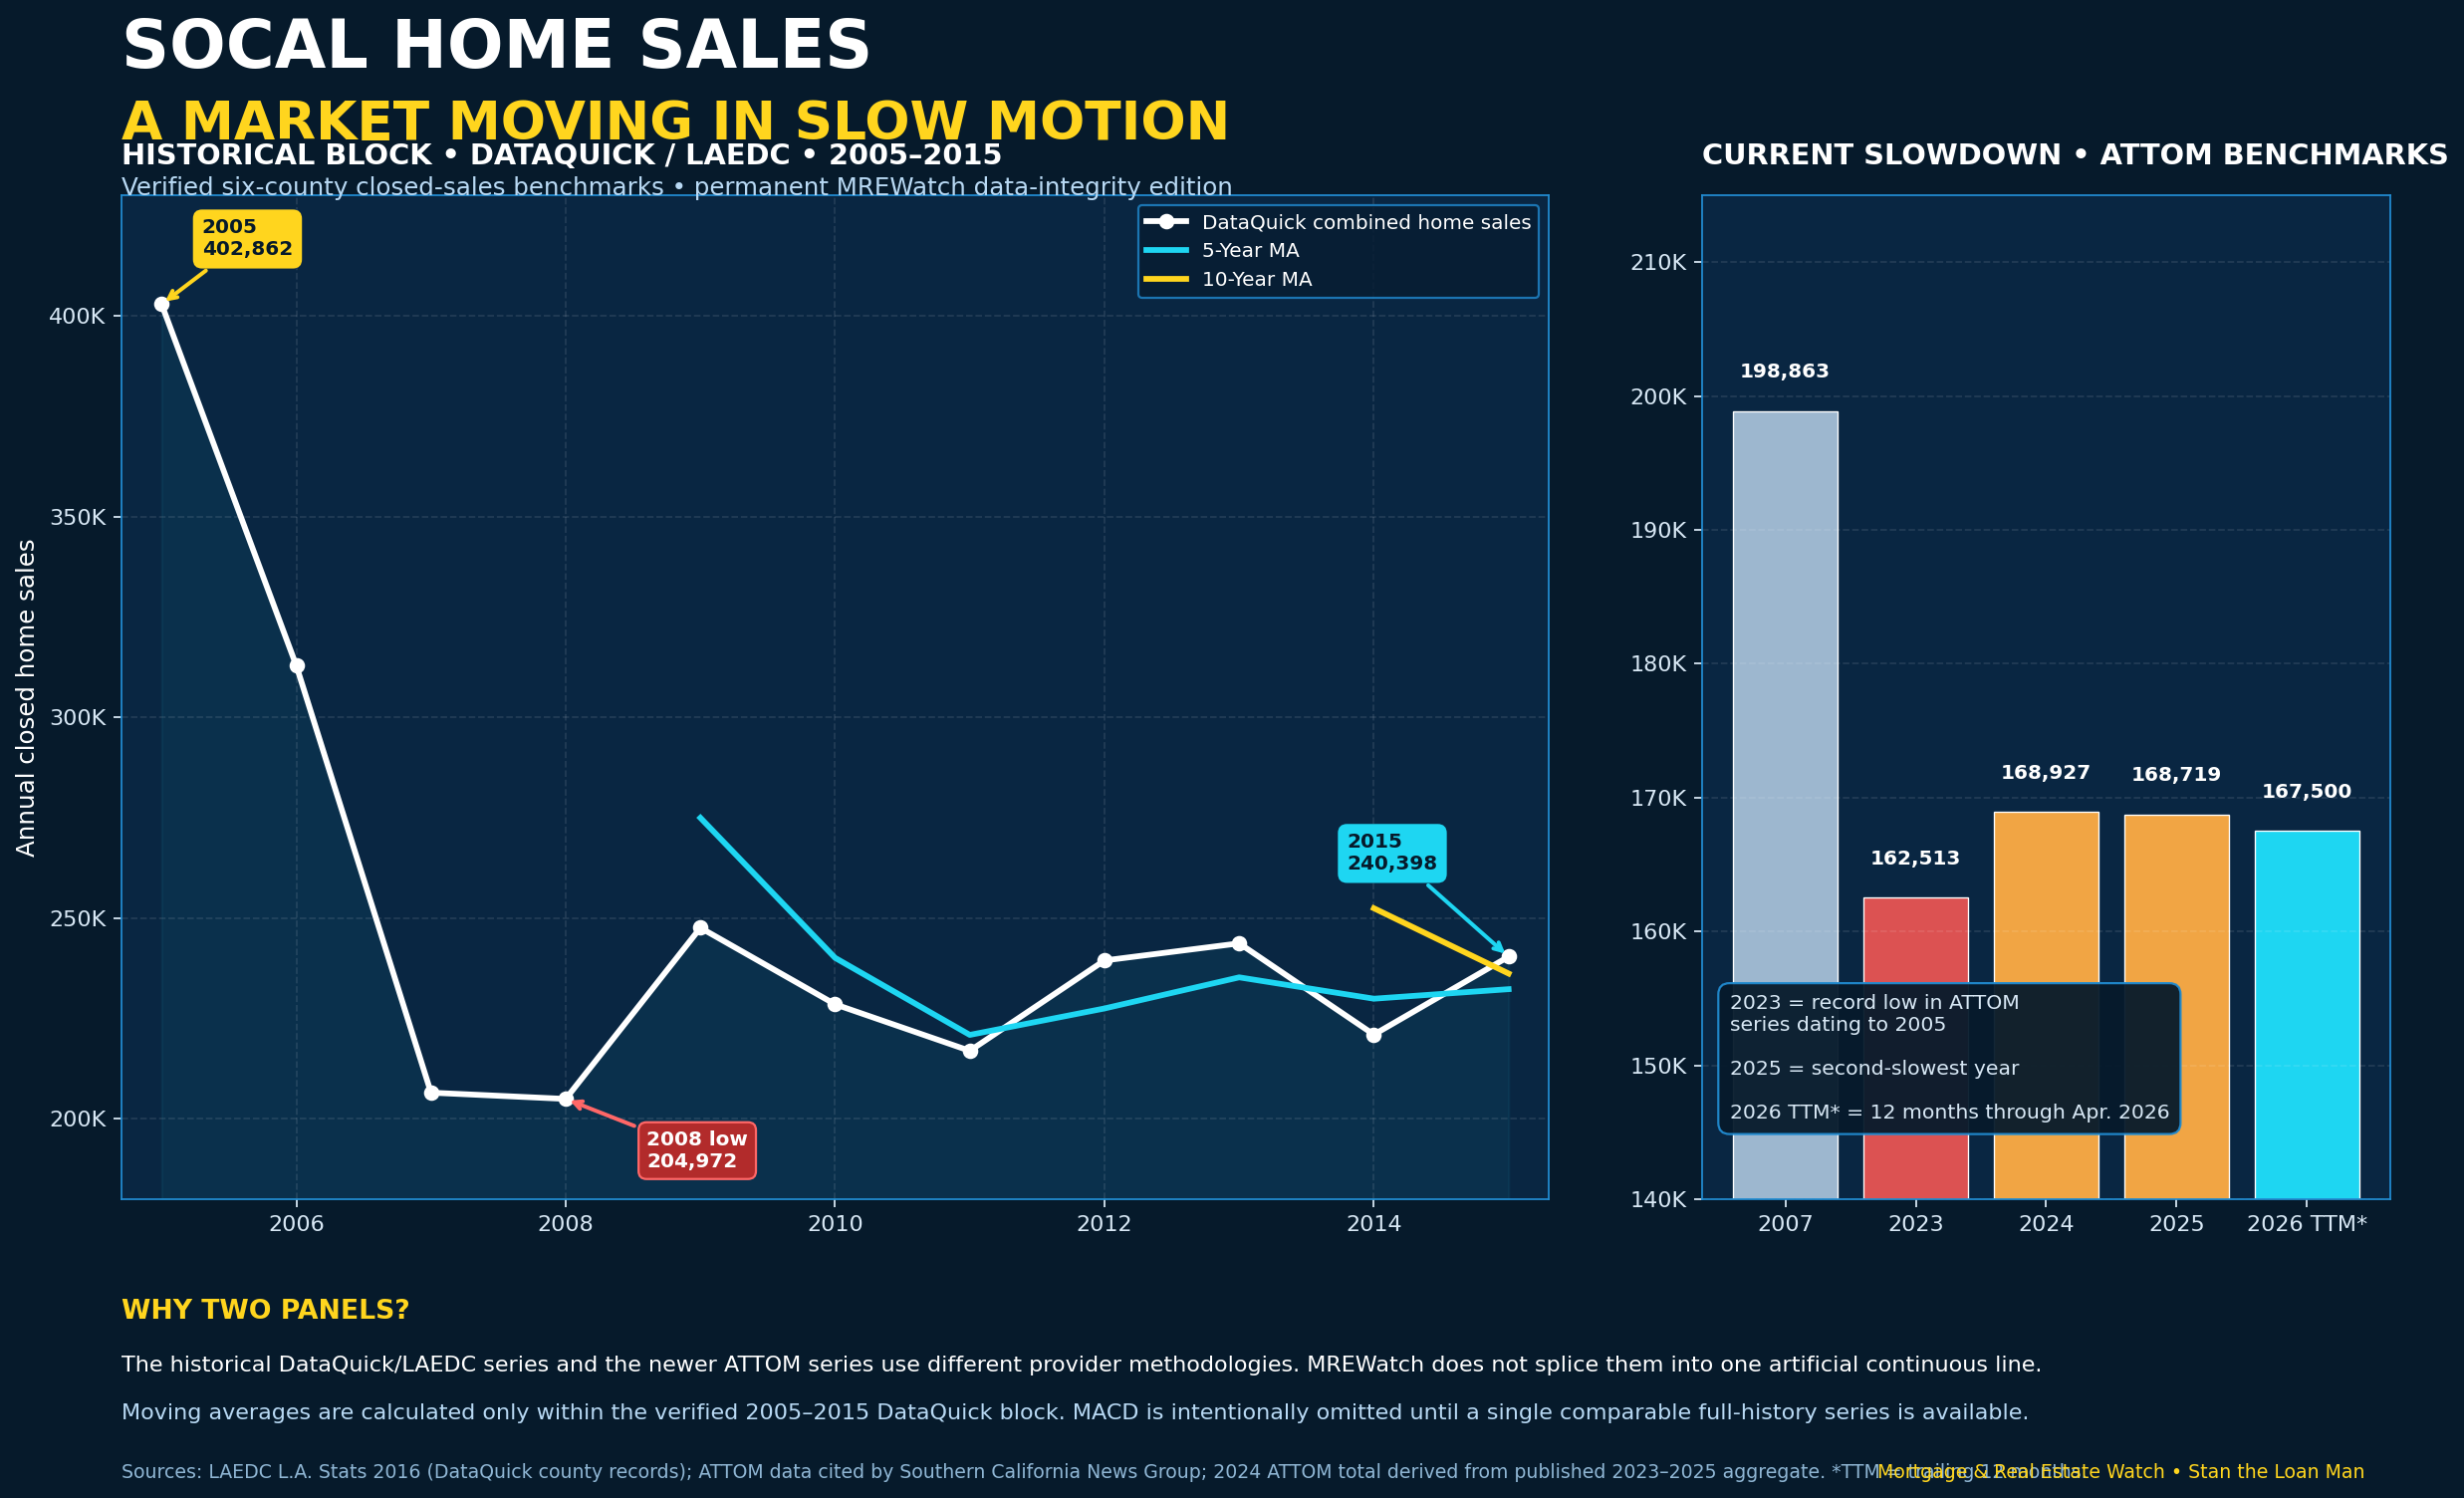
ATTOM’s broad-market transaction series — houses and condominiums, both existing and newly constructed — shows just 162,513 completed sales in 2023, the lowest annual total in its Southern California record dating to 2005. The next two years barely improved: the published 2023–2025 three-year total was 500,159 sales, which implies 168,927 in 2024, followed by 168,719 in 2025. That made 2025 the second-slowest year in the 21-year record.
For perspective, ATTOM counted 198,863 sales in 2007, when the prior housing bubble was already falling into the Great Recession. Yet 2023, 2024 and 2025 all ran below that level.
The current cycle has remained subdued into 2026. Through April, the trailing 12-month total was 167,500 transactions, 28% below the historical pace and only 4% above the low point set in June 2024.
A longer historical view
The left side of the chart uses an older DataQuick series published by the Los Angeles County Economic Development Corporation. Within that internally consistent 2005–2015 block, six-county combined home sales fell from 402,862 in 2005 to 204,972 in 2008, then recovered only partially during the following years.
The 5-year moving average in that historical block rolled sharply lower as the housing-boom years dropped out of the calculation. The 10-year moving average, once enough observations were available, also reflected the much lower post-boom transaction regime.
Why the permanent chart does not show one 2000–2026 line or MACD.
The original social-media graphic was designed before the historical series had been fully reconciled. In researching the permanent RatesOutlook version, I found that older DataQuick/CoreLogic reports, current ATTOM transaction data, and C.A.R. regional sales statistics do not all measure exactly the same universe of homes.
Rather than combine incompatible definitions into an apparently precise continuous series, this article keeps the verified provider blocks separate. Moving averages are calculated only inside the internally consistent DataQuick historical block. I am intentionally not publishing MACD across a mixed-provider series until a single comparable full-history dataset is available. Technical indicators are only as reliable as the underlying data.
Prices and sales volume can tell two different stories
This is where the current Southern California market becomes especially interesting.
ATTOM reported that the six-county median sale price reached a record $840,000 in May 2026. Yet May’s 18,345 sales were still 13% below the typical May pace since 2005. In other words, the market could set a price record while transaction activity remained below normal.
C.A.R.’s separate existing-single-family-home series tells a similar directional story. In August 2026, Southern California sales fell 4.8% year over year while the regional median price rose 2.9% to $900,000. C.A.R. also reported a 3.8-month unsold inventory index and a 29-day median time on market for Southern California. These statistics use a different property universe than ATTOM, but they reinforce the same broader point: softer activity does not automatically mean collapsing prices.
Why can prices stay firm when sales are so weak?
Housing prices are set by the properties that actually transact. If fewer owners are willing to sell and fewer buyers can afford to purchase, the market can experience low turnover without producing enough excess inventory to force prices dramatically lower.
Several forces are contributing to that friction:
- Higher mortgage rates increase the monthly payment required for the same home price.
- Affordability pressure remains severe after years of price appreciation.
- Payment sensitivity causes buyers to scrutinize monthly carrying costs and financing structure more closely.
- Mortgage-rate lock-in can discourage owners from giving up older, lower-rate financing.
- Selective sellers may choose not to list if they cannot obtain the price they want.
- Economic and rate uncertainty can delay decisions on both sides of the transaction.
The bond market is part of the housing story
Housing affordability is not simply a function of home prices. It is a function of price plus financing cost.
That is why a move in Treasury yields or mortgage-backed securities can affect Southern California housing activity before the change becomes obvious in closed-sales statistics. Mortgage rates are influenced by the 10-year Treasury, MBS pricing and spreads, inflation expectations, labor-market data, economic growth, investor demand and market volatility.
The Federal Reserve matters, but the Fed does not directly set the 30-year fixed mortgage rate. The bond market continuously reprices expectations — often before the next Fed meeting.
What a slower market can mean for buyers
A slower market is not automatically a bad market for a buyer. Depending on the property and submarket, less frantic transaction activity can create more time to evaluate a purchase, more negotiating flexibility, potential seller concessions, or opportunities to structure financing differently.
But payment remains central. A borrower should evaluate the home and the financing together rather than treating the mortgage as an afterthought.
What it can mean for sellers and real-estate professionals
Lower turnover changes market psychology. Pricing precision becomes more important. Buyers may negotiate more aggressively. Properties can require more time and stronger presentation. And the market can feel substantially softer on the ground than a median-price headline suggests.
That is why I believe price and transaction volume should always be read together.
Do not reduce the financing decision to one headline rate.
When rates are elevated, borrowers may want to compare the full structure of the loan: fixed-rate options, ARMs, interest-only programs where appropriate, temporary buydowns such as a 3-2-1 strategy, permanent buydowns, lender credits, expected holding period and potential refinance strategy.
At West Capital Lending, our wholesale platform provides access to a broad lender network and multiple program structures. The objective is to identify a competitive financing solution for the borrower’s actual qualifications, property, timeline and goals — not simply chase the lowest advertised rate.
The next major housing catalyst may come from the bond market.
The U.S. Bureau of Labor Statistics is scheduled to release the September Employment Situation on Friday, October 2 at 8:30 a.m. ET. Payroll growth, unemployment and wage data can move Treasury yields quickly, which can flow through to mortgage-backed securities and consumer mortgage pricing.
For a housing market already dealing with affordability and payment sensitivity, even a modest change in mortgage rates can affect purchasing power and transaction activity. I will be watching whether the labor data adds upward pressure to yields and mortgage rates — or provides buyers with some relief heading into October.
Stan the Loan Man’s Take
Southern California real estate is still moving — but it is moving much more slowly than buyers, sellers, Realtors and lenders became accustomed to during the ultra-low-rate years.
The defining feature of this market is not simply whether home prices are rising or falling. It is the interaction of high prices, financing costs, affordability, reluctant sellers, selective buyers and unusually low turnover.
Sometimes the most important housing-market signal is not the price of homes.
It is the number of homes actually changing hands.

Founder, RatesOutlook · Branch Manager & Mortgage Loan Originator, West Capital Lending · NMLS #2607530. Stan writes about mortgage rates, Treasury markets, housing data and borrower financing strategy.
Verify NMLS licensing · West Capital Lending · Company licensing
LAEDC, L.A. Stats 2016 — DataQuick Information Systems, county-record combined home sales for Los Angeles, Orange, Riverside, San Bernardino, San Diego and Ventura counties.
Southern California News Group / ATTOM — 2007 and 2023–2025 broad-market transaction benchmarks. The 2024 value shown in the chart is arithmetic derived from the published 2023–2025 aggregate less the separately published 2023 and 2025 totals.
Southern California News Group / ATTOM — May 2026 six-county median price and monthly sales context.
California Association of REALTORS®, August 2026 report — separate existing single-family-home regional series used only as a current-market cross-check.
U.S. Bureau of Labor Statistics 2026 release calendar — September Employment Situation release date.
This article is for informational and educational purposes only. Data-provider definitions differ, so unlike-series are not presented as one continuous time series.